Introduction
Dual EDS detectors not only double the throughput while maintaining a single detector’s energy resolution, but also play an important role in mitigating shadowing and topographic artifacts when mapping particles or samples with rough or fracture surfaces. For samples with flat and smooth surfaces, doubled throughput gives more statistics to ensure higher quality and more accurate map data. For non-ideal samples, the artifacts associated with shadowing and topography can be minimized with dual detectors. X-rays generated from particles or other small objects may be shadowed by adjacent large objects, resulting in signal attenuation. This effect also applies to samples with severe surface topography that may include high topography regions that attenuate, or block X-ray signals generated from low topography regions. Additional complexities come from surfaces that are significantly inclined towards the detector and other surfaces that are tilted away from the detector, producing take-off angle variations which alter X-ray signal intensities. When the electron beam is scanning over a particle, the take-off angle also changes as the beam moves from one side to the other side of the particle along the spherical surface. To explore what we gain with dual EDS detectors, we acquired EDS map data from both ideal and non-ideal samples with Octane Elite Super (detector 1) and Octane Elect Super (detector 2) Silicon Drift Detectors positioned with different azimuthal angles using APEX™ 2.1 Software.
Results and Discussion
In general terms, the doubled throughput results in higher quality map data or collection efficiency. For this example, a floor tile sample with a flat and smooth surface was mapped. Figure 1 provides an overview of the sample with the SEM image, summed Counts Per Second (CPS) map, and Region of Interest (ROI) maps of selected elements from both detectors. The CPS map (Figure 1b) is a visual representation of the X-ray count rate at every pixel in the dataset, where the brighter pixels depict areas with higher count rates. A notable feature of this sample is that it contains many calcium phosphate and zirconium silicate grains. However, the elemental maps of P K and Zr L (Figure 1e and 1f) look almost identical, although some grains have different signal intensities. This is because P K and Zr L peaks are heavily overlapped with only 29 eV of energy difference. The ROI maps are based on raw X-ray counts only, so peak overlaps are not compensated for. The overlapping peaks can be resolved by background subtraction and peak deconvolution or further running a full quantification routine at every pixel in the dataset. Figure 2 shows Wt% maps of P K and Zr L rebuilt from a single detector and summed ROI maps. In the single detector Wt% maps of P K (Figure 2a and 2b), there are slight noise pixels in the bottom right, which correspond to the silicon-rich phase indicated in Figure 1c. There are more obvious noise pixels in Zr L maps (Figure 2d and 2e), mainly from the contributions of iron-rich inclusions shown on the right of Figure 1d and residuals of the phosphorus phase. These noise pixels cannot be separated from the background due to insufficient statistics. In the maps rebuilt from summed ROI maps (Figure 2c and 2f), many of the noise pixels have been cleaned up, and the backgrounds are much more uniform because the summed statistics from the two detectors were used. While conducting background subtraction and peak deconvolution, the total counts play a vital role. Summing the X-ray counts from dual detectors helps increase the number of counts per pixel to get better and more accurate results.
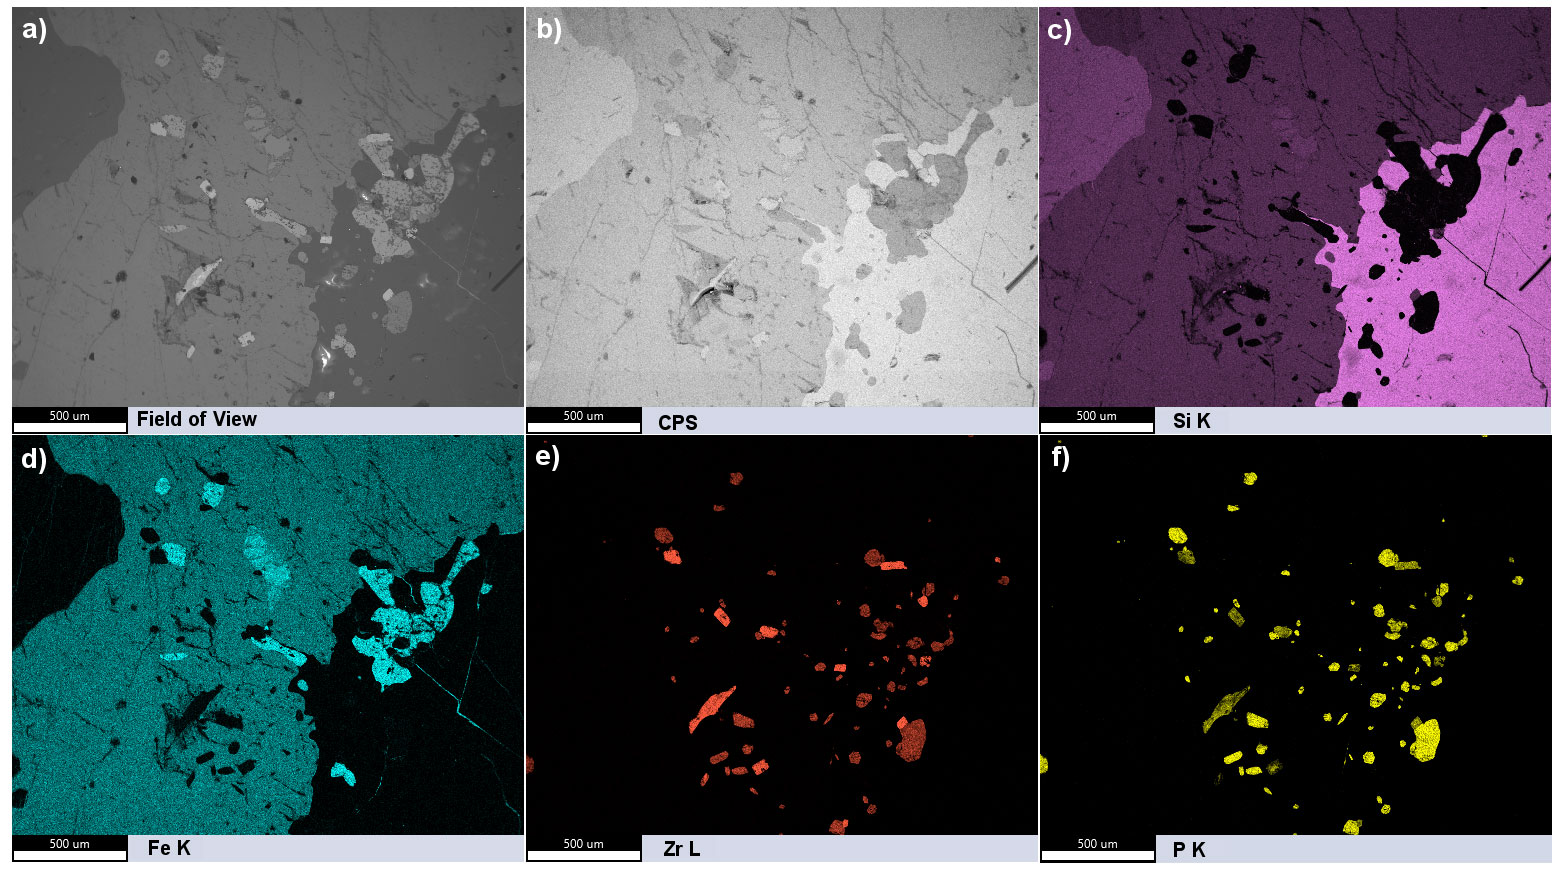
Figure 1. Overview of the dual detector data from a floor tile sample. An a) SEM image and b) summed CPS map of the field of view. c-f) Summed ROI maps of Si K, Fe K, Zr L, and P K, respectively.
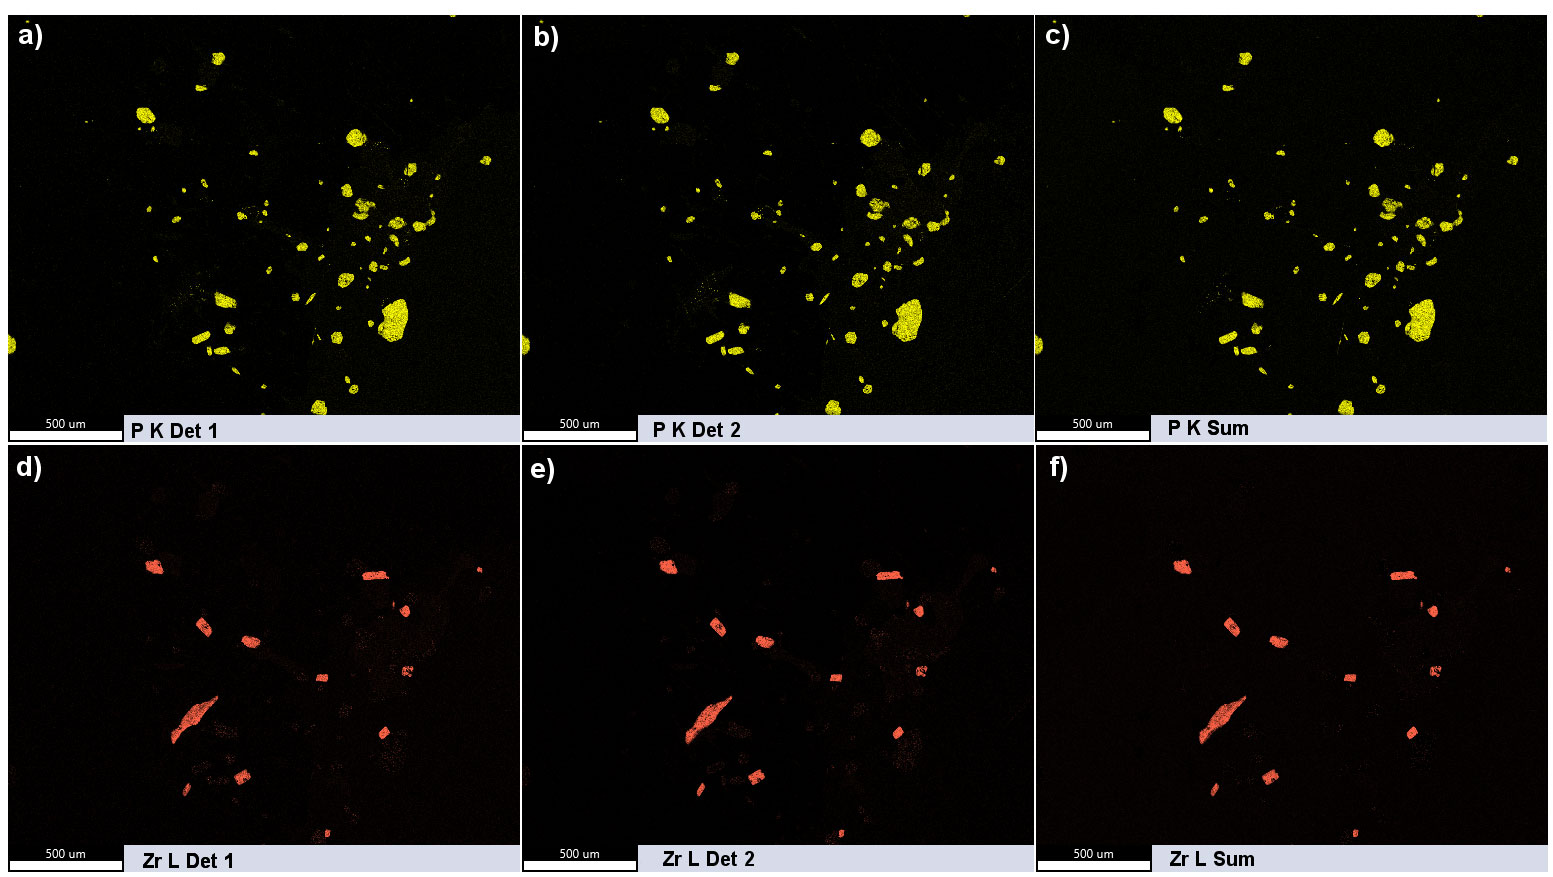
Figure 2. Wt% maps of P K rebuilt from counts from a) detector 1 and b) detector 2, and c) the summed counts from both detectors. d-f) Corresponding Zr L maps of the above maps. A processed high contrast and brightness version of this figure is shown in Figure 3.
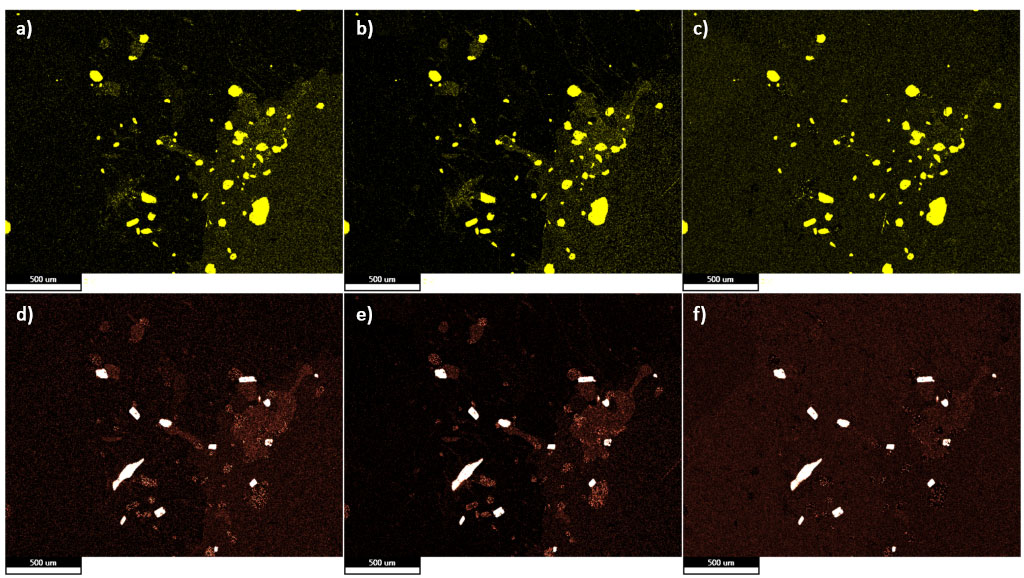
Figure 3. High contrast and brightness image of Figure 2 to highlight the background outside the calcium phosphate and zirconium silicate grains.
The artifacts associated with non-ideal samples are much more challenging to deal with when mapping with a single detector. In this experiment, quartz particles were mapped simultaneously with dual detectors, and the two sets of data were merged. The CPS and elemental maps collected were used to evaluate the severe topographic and shadowing artifacts exhibited by this sample. The black areas in these maps indicate signal attenuation where little to no X-rays are received by the detector, since this is a homogeneous sample all regions have the same X-ray yield. In the CPS map collected by detector 1 (Figure 4a), the circled dark region shows where X-ray signals are shadowed by adjacent particles, while the corresponding region in the map from detector 2 (Figure 4b) is facing towards the detector and more X-ray counts are received by the detector. Simply summing these two maps increases the number of counts per pixel and gives the shadow artifacts from both detectors (Figure 4c). In Figure 4d, the maximum signal at each pixel between the two single detector CPS maps was used, and the double shadowing and contributions of topography are significantly alleviated. Since the signal from only one map or the other is used, this does not increase statistics or spectral quality.
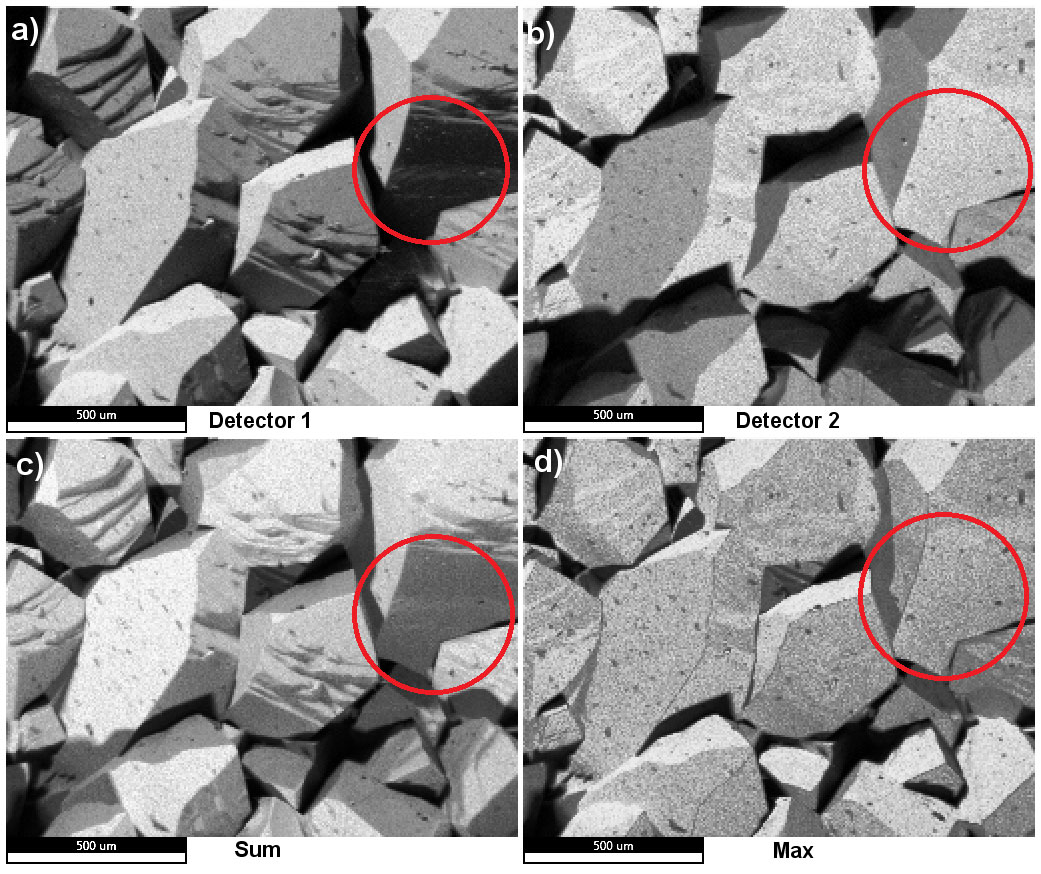
Figure 4. CPS maps of quartz particles from a) detector 1 and b) detector 2, c) the sum of the CPS maps from both detectors, and d) the maximum signal CPS map.
When doing contamination assessment or failure analysis, it is important to cover as many objects of interest as possible. An iron oxide sample was mapped using the same dual EDS detector setup to evaluate the phosphorus distribution as surface contaminants. The CPS maps from both detectors indicate that this sample has an extremely rough fracture surface with prominent shadow zones (Figure 5a and 5b). Although their corresponding P K maps show a large amount of phosphorus particles and the distributions look somewhat even (Figure 5d and 5e), there are missing particles in the circled regions from either elemental map. The topographic effects in the single detector CPS maps are mitigated in the merged CPS map using the maximum signal function (Figure 5c), and the shadowing is resolved in the maximum signal P K map to represent more accurate data (Figure 5f). To quantify data quality improvement, the three CPS maps were converted into binary images to measure the phosphorus particles' density. The particle density calculated from maps collected by detector 1 and detector 2 was 6504 particles/mm2 and 6178 particles/mm2, respectively. However, the density in the merged map was 7795 particles/mm2, which means neither detector captured a significant number of particles on the sample surface.
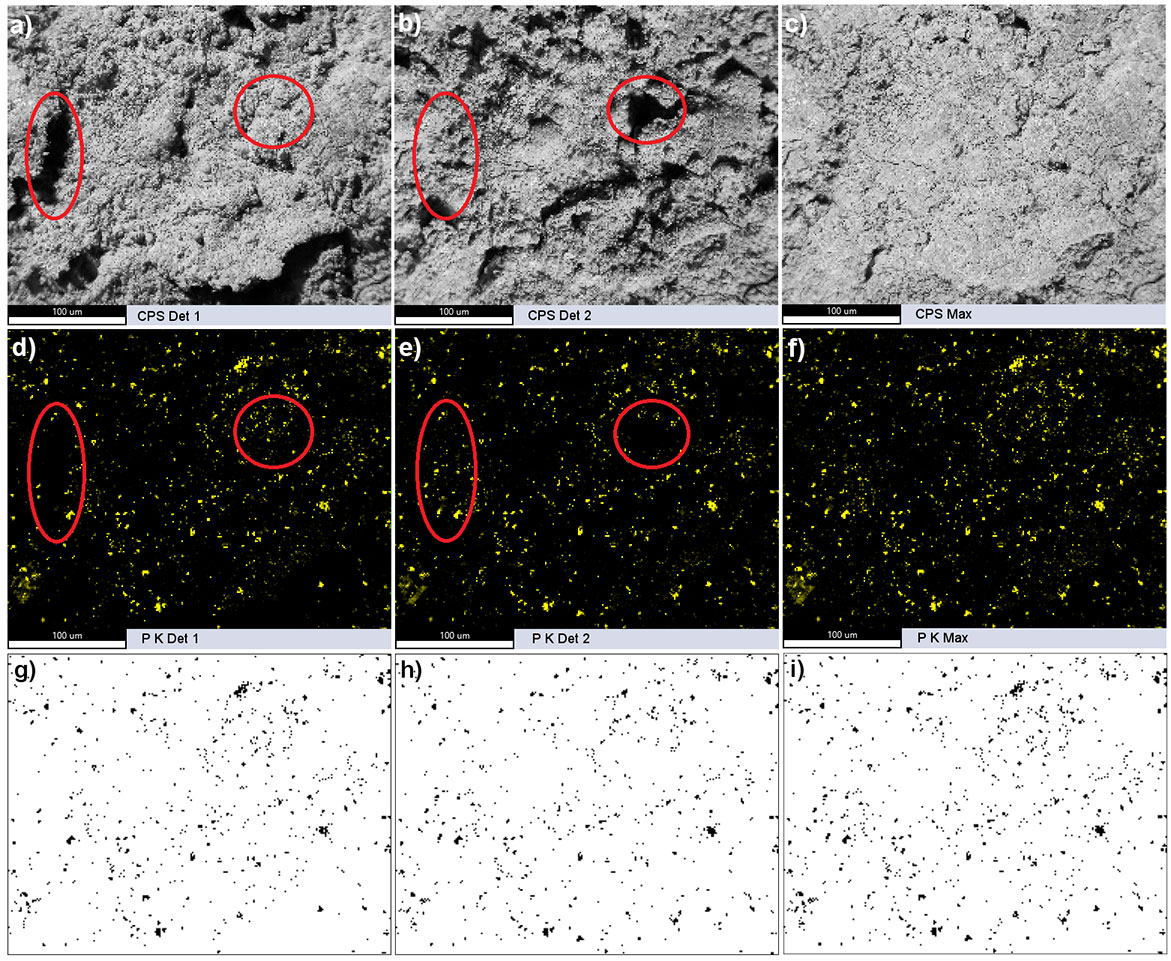
Figure 5. CPS maps collected from a) detector 1 and b) detector 2, and c) the maximum signal CPS map. d)-f) Corresponding elemental maps of P K of the above maps. The red circles highlight regions with missing signals from either detector. g-i) Binary images of the above elemental maps.
Conclusion
Using the same conditions, dual detectors double the throughput while maintaining a single detector’s resolution to generate higher-quality map data or shorten the data collection time. For samples that cannot tolerate high beam currents, dual detectors enable better map data to be acquired using lower beam currents. When dealing with non-ideal samples, dual EDS detectors are very useful for mitigating the shadowing and topographic effects associated with particles and rough or fracture surfaces. Selecting the maximum signals between the two sets of maps from dual detectors is a more efficient way to resolve these artifacts than using the sum of the maps.