Introduction
With the addition of wavelength dispersive spectroscopy (WDS) capabilities in the latest user-friendly EDAX APEX 3.0 software, users can seamlessly integrate the new functionalities and employ WDS when and where energy dispersive x-ray spectroscopy (EDS) reaches the limit. WDS significantly enhances the accuracy of results by resolving EDS peak overlaps, improving the minimum detection limit by 10x, and providing precise quantification.
Results and Discussion
EDS suffers insufficient energy resolution to differentiate energy lines close to each other. For instance, Si K, W M, and Ta M lines are separated by a mere 30 eV energy difference. If the three elements are present in the same region of interest, they manifest as an indistinguishable peak in the EDS spectrum (Figure 1 red outline). As depicted by the WDS spectrum (Figure 1 cyan color), EDAX Lambda WDS systems effectively resolve such ambiguities in analysis intrinsically with up to 15x better energy resolution than typical EDS systems.
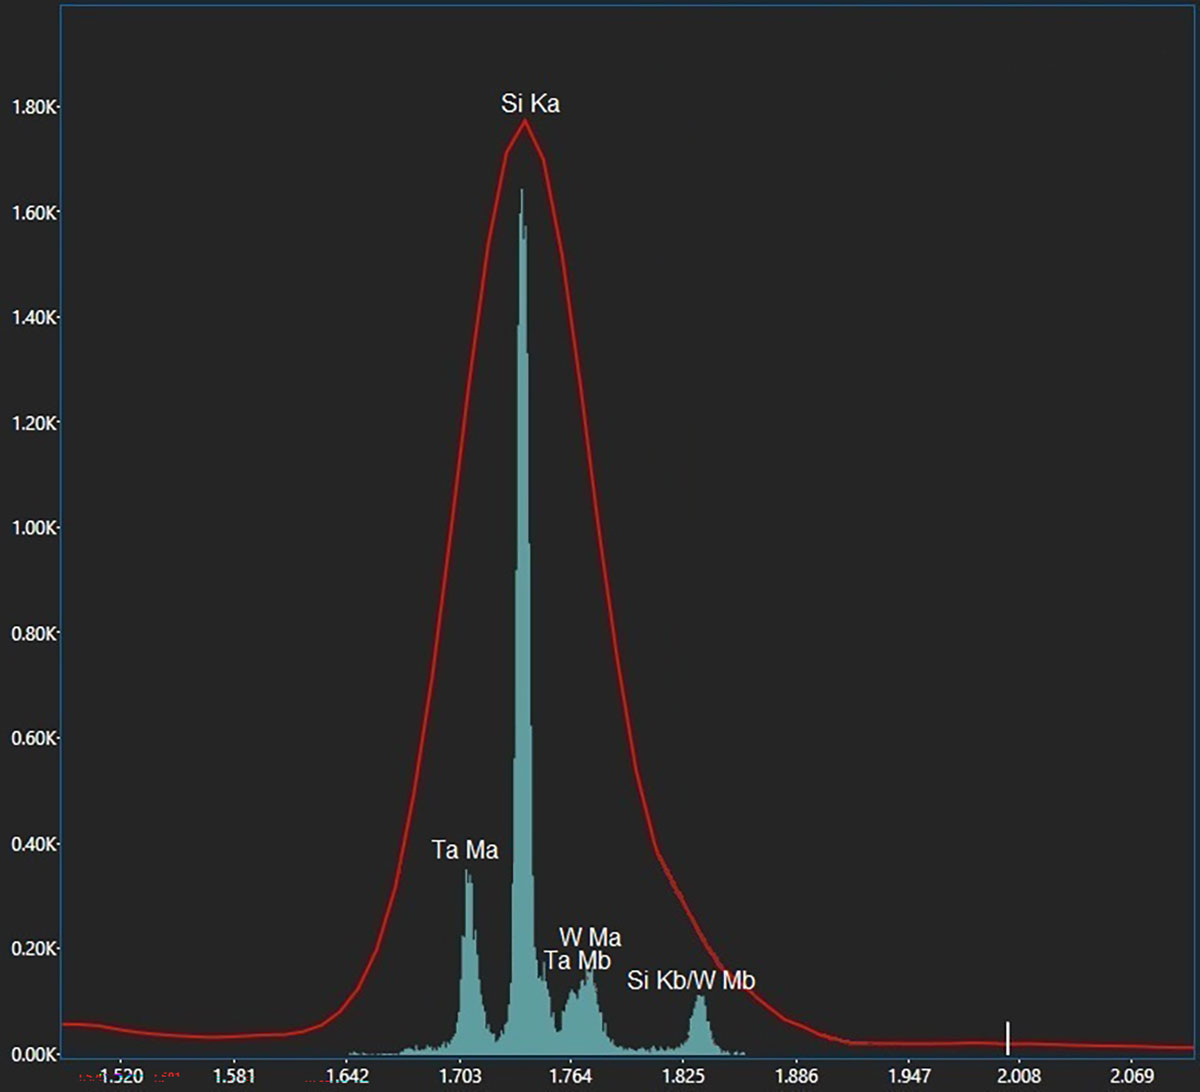
Figure 1. An overlay of EDS (red outline) and WDS (cyan color) spectra of a Si-W-Ta sample.
In a Si-W-Ta sample, EDS struggles to differentiate these peaks, presenting them as identical distributions in the EDS maps (Figure 2 top). In contrast, WDS generates distinct visualizations of the individual distributions of these elements (Figure 2 bottom).

Figure 2. EDS (top) and WDS (bottom) maps of the Si-W-Ta sample. The WDS maps resolve the artifacts due to Ta M, Si K, and W M peak overlaps in the EDS maps.
WDS reliably detects minor and trace elements with improved peak-to-background ratios (P/B), achieving detection limits up to 10x lower. For example, in a borosilicate glass containing
2 wt% of boron, the boron peak is hardly visible in the EDS spectrum. However, a clear boron peak is present in the WDS spectrum (Figure 3) owing to significantly lower detection limits. The Lambda WDS system, featuring a parallel beam design, also offers up to 8x higher P/B than Rowland’s Circle WDS systems.
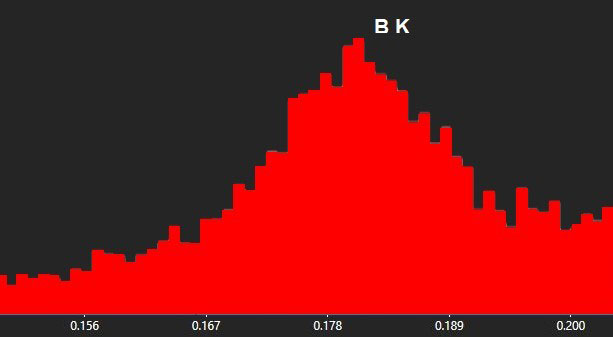
Figure 3. The boron peak in the WDS spectrum of a borosilicate glass containing 2 wt% boron.
The improved energy resolution and higher P/B make WDS an excellent tool for resolving the transition metal L lines. Alloy surface and inclusion analyses often need lower accelerating voltages to reduce the excitation volume. However, transition metal L line peaks have too many overlaps to be resolved by EDS, and P/B can be low (Figure 4 red outline) at 5 kV. On the other hand, WDS delivers data with superior peak separation and P/B to detect transition metal L line peaks that are difficult to observe by EDS alone (Figure 4 cyan color) at the same accelerating voltage.
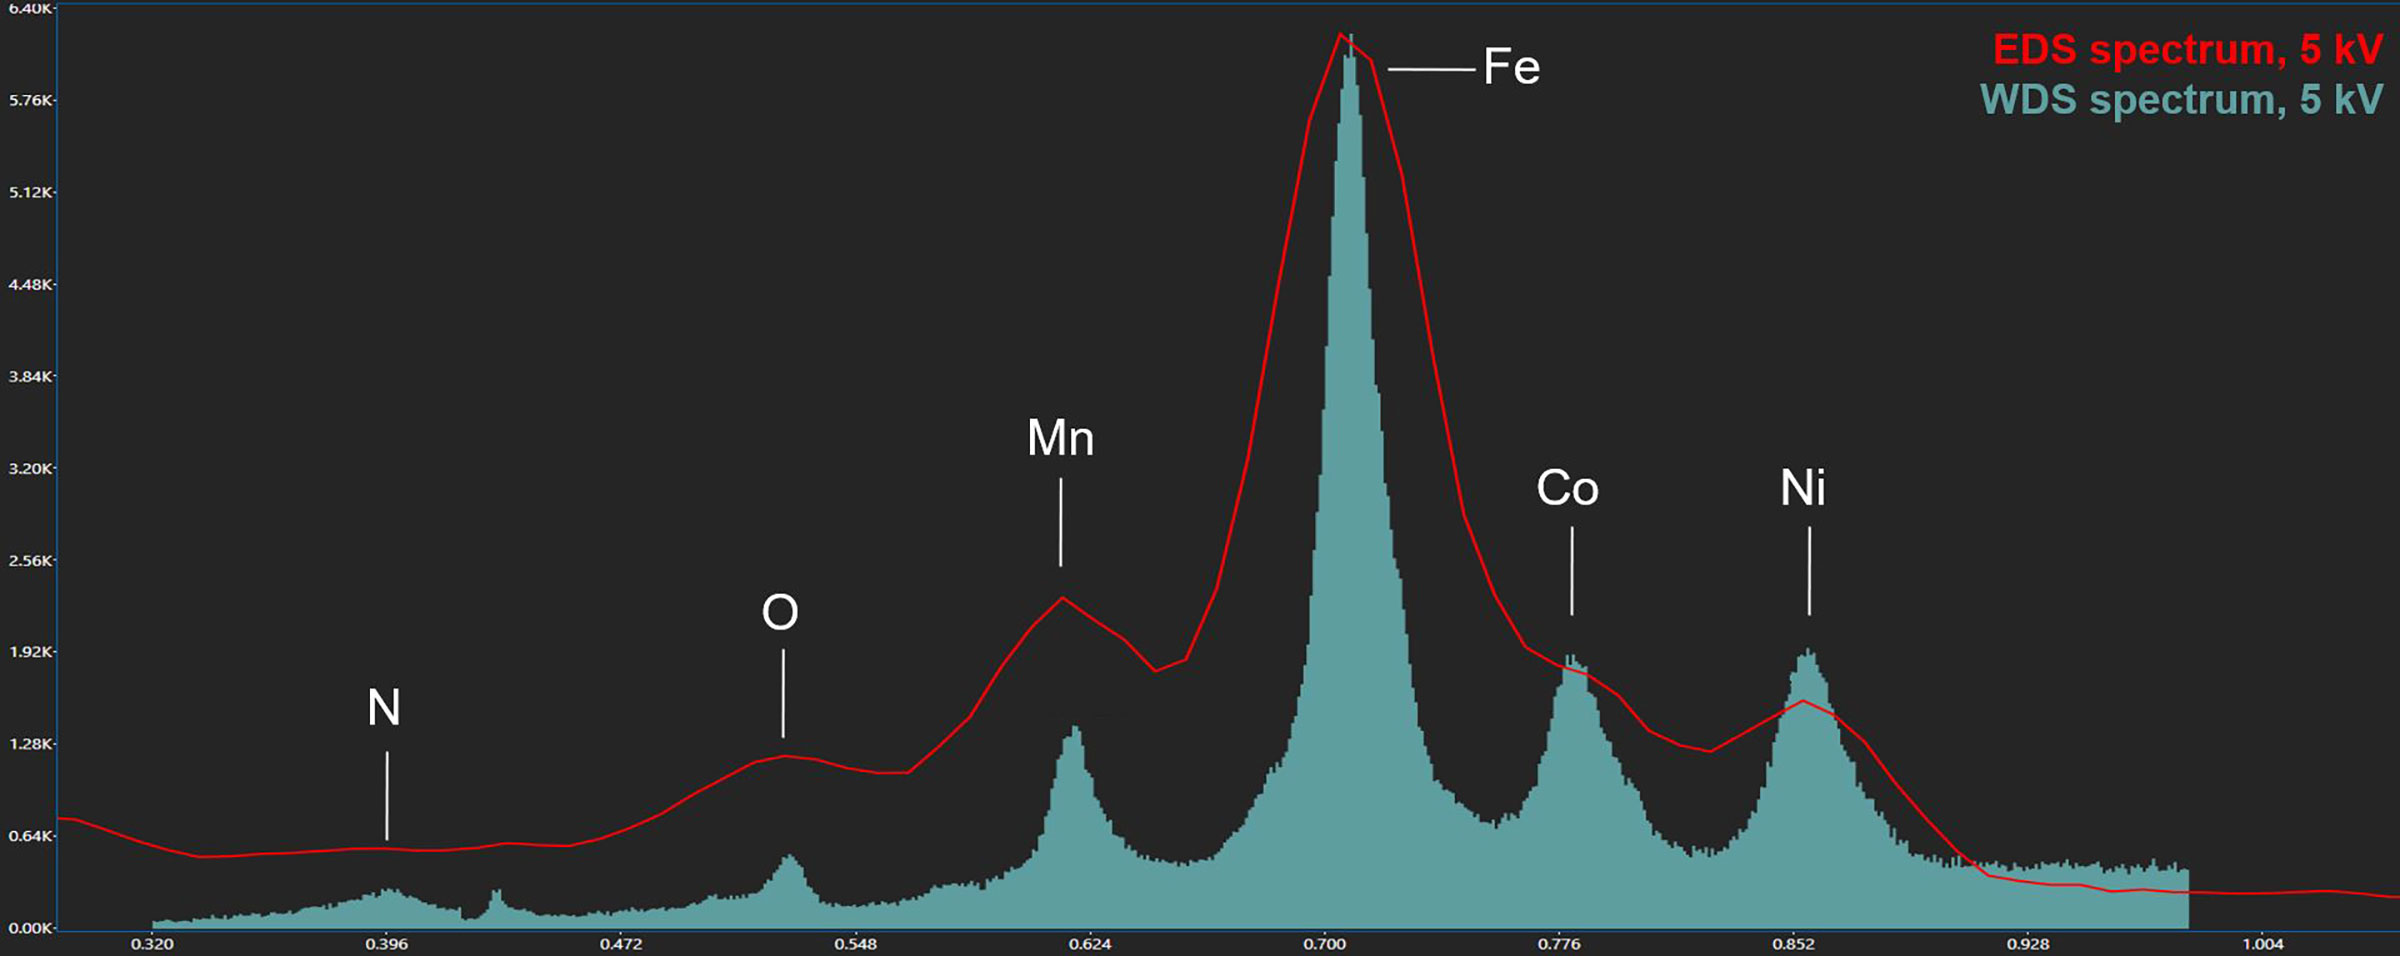
Figure 4. An overlay of EDS (red outline) and WDS (cyan color) spectra of an alloy sample at 5 kV.
The combined EDS/WDS quantitative analysis employs a robust analytical algorithm, ensuring reliable elemental quantification. Quantitative results from standardless EDS analysis of a Ni monocrystal reveal considerable discrepancies in Ta, W, and Re due to severe peak overlaps (Table 1). The combined EDS/WDS quantification enables Al, Ta, W, and Re to be quantified with WDS, while the other elements are quantified via EDS, resulting in concentrations consistent with the actual values.
| Element |
|
Wt. % (EDS) |
|
Wt. % (EDS and WDS) |
|
Discrepancy |
|
Actual Wt. % |
| Al |
|
6.30 |
|
6.62 |
|
5% |
|
|
| Ta |
|
9.61 |
|
7.48 |
|
28% |
|
7.50 |
| W |
|
7.57 |
|
4.75 |
|
59% |
|
4.75 |
| Re |
|
2.19 |
|
3.01 |
|
27% |
|
3.00 |
| Mo |
|
0.79 |
|
0.74 |
|
7% |
|
|
| Ti |
|
1.11 |
|
1.15 |
|
3% |
|
|
| Cr |
|
6.21 |
|
6.04 |
|
3% |
|
|
| Co |
|
7.83 |
|
7.56 |
|
4% |
|
|
| Ni |
|
58.39 |
|
57.56 |
|
1% |
|
Table 1. Quantitative results of a Ni monocrystal.
Conclusion
In conclusion, improved energy resolution, sensitivity, precession, and P/B position WDS as an invaluable supplement to EDS detectors. The new APEX 3.0 is the ultimate materials characterization software, integrating EDS, WDS, and EBSD to deliver previously unattainable solutions.