Introduction
Aluminum-silicon alloys are commonly used in automotive and aerospace applications due to their high specific strength, good corrosion resistance, and high wear resistance. Producing these alloys via additive manufacturing offers additional benefits, including superior mechanical properties compared to traditional cast materials, reduced thermal cracking, and the ability to create customized and complex designs. Adding silicon to these alloys helps improve these properties but can also increase the brittleness. To optimize the properties of these alloys, it is essential to characterize and understand the microstructures that develop due to the alloy composition and the additive manufacturing process and parameters used.
Discussion
Electron backscatter diffraction (EBSD) is a typically used and powerful tool for analyzing additively manufactured crystalline materials. However, Aluminum-silicon alloys pose a challenge to traditional EBSD analysis. The primary phases present in these alloys are the alpha aluminum phase and a pure silicon phase. The aluminum phase is face-centered cubic (FCC), while the silicon phase is diamond cubic. In the FCC phase, atoms are located at the corners and face centers of the unit cell. The diamond cubic crystal structure is based on a face-centered Bravais lattice and contains two atoms in the basis. The unit cells for aluminum and silicon are shown in Figure 1.
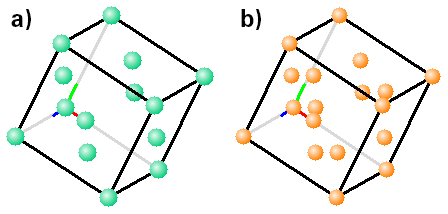
Figure 1. Unit cells for a) aluminum and b) silicon. Corner and face-centered sites are occupied in both cells, with the silicon unit cell having additional atoms.
The similarities of these crystal structures result in similar EBSD patterns, as shown in Figure 2. These show simulated EBSD patterns from aluminum and silicon using a kinematic diffraction model. These simulations show the diffraction bands of the highest intensity, which correspond to the bands most likely to be detected with the Hough transform image processing used in traditional EBSD pattern indexing. Because both phases have a common FCC lattice basis, many diffraction bands are common between these phases. If these common bands are the ones detected and used for indexing, it is difficult to reliably differentiate the aluminum and silicon phases with EBSD alone, as shown in Figure 3.

Figure 2. Kinematic diffraction simulations for a) aluminum and b) silicon. Both simulated patterns show common band positions for higher-intensity diffracting planes for these crystal structures.

Figure 3. EBSD phase map using traditional Hough-based indexing for aluminum-silicon additively manufactured alloy. The speckled distribution of both phases shows the difficulty with this phase differentiation.
Spherical indexing, a new and powerful approach to EBSD pattern indexing, is used to address this issue. Spherical indexing is available within the optional EDAX OIM Matrix™ module within the EDAX OIM Analysis™ software. For spherical indexing, each experimentally collected EBSD pattern is compared against a master pattern simulation of each candidate phase (aluminum and silicon, in this case), and the best match is selected for the determined phase and orientation. This approach uses all the information within the experimental patterns and is more sensitive to the pattern differences between these two phases. Figure 4 shows representative experimental EBSD patterns from the aluminum and silicon phases, with corresponding simulations of the determined orientation for both the aluminum and silicon phases. A dynamic diffraction model was used for these simulations to create the master pattern used for spherical indexing. Comparing the simulations shows that the additional bands in the silicon patterns are visible but have a weaker intensity, making detection less likely with the Hough transform for traditional indexing.

Figure 4. Experimental EBSD patterns from the aluminum and silicon phases, with dynamical diffraction simulations for both phases for the corresponding orientation. The selected phase is highlighted in red.
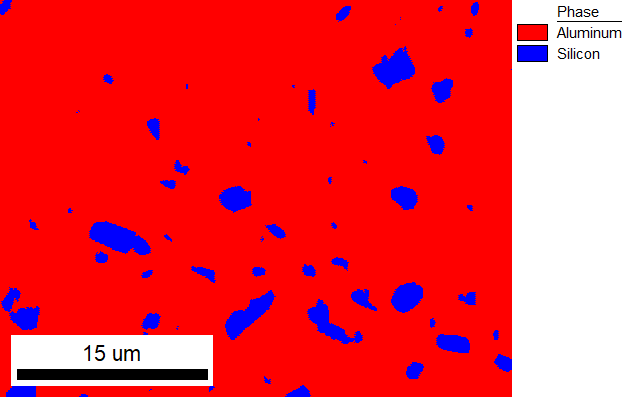
Figure 5. EBSD phase map using spherical indexing for aluminum-silicon additively manufactured alloy. The phases are clearly differentiated with this approach.
In contrast, using the spherical indexing approach, which utilizes all the information within the pattern for indexing,
increases sensitivity to these subtle differences and improves phase differentiation, as shown in Figure 5.
Why is correctly differentiating these phases important? The single FCC unit cell model could be used to determine the orientation of both phases correctly. However, if investigators want to dive deeper into understanding the microstructure, it is important to be able to separate the aluminum and silicon phases and analyze both these phases separately, as well as in the aggregate. An example of this is shown in Figure 6, where the grain boundary disorientation distribution is shown for both the aluminum and silicon phases, as well as the combined distribution (termed All Data). This distribution indicates that there is a significant peak at 60° disorientation, which is primarily found in the silicon phase. This is an important disorientation, as it corresponds to twins in the material, which are grain boundaries with potentially beneficial properties. The grain size, phase fraction, orientation distribution, and grain boundary character of both phases can be examined by correctly differentiating both phases using spherical indexing. This information can be used to refine the additive manufacturing parameters and optimize the final properties.

Figure 6. Disorientation distributions for the aluminum and silicon phases, and both phases combined (termed All Data).
Conclusion
Spherical indexing improves indexing and phase differentiation performance compared to conventional Hough indexing. This allows for accurate characterization of phase distribution and microstructural information, including crystal orientation, grain boundary character, and grain size. Characterizing and understanding this information is a key requirement for optimizing additive manufacturing processing parameters and final material properties.