Introduction
Silicon carbide is a crucial material in power electronics, enabling the development of smaller, lighter, and more efficient systems that operate at higher voltages and temperatures than traditional silicon-based systems. Silicon carbide devices are crucial in applications such as electric vehicles, power supplies, and solar inverters, where high efficiency and performance are required.
Silicon carbide can form multiple polytypes, or phases with the same chemistry but different crystallographic structures. Common polytypes for silicon carbide are the cubic 3C phase (SiC beta phase), the hexagonal 4H phase, and the hexagonal 6H phase. These phases have different electric and thermal properties, including bandgap values, electron mobility, and thermal conductivity. Additionally, the hexagonal 4H and 6H phases have anisotropic properties that vary with crystal orientation. These properties define device performance, with 4H preferred for modern power electronics.
Because these polymorphs have the same composition, they are difficult to detect and differentiate with backscatter electron (BSE) imaging or with energy dispersive spectroscopy (EDS). Electron backscatter diffraction (EBSD) is the ideal tool for differentiating crystallographic polymorphic phases. However, in the case of silicon carbide, the differences between the phases, particularly the 4H and 6H phases, can be subtle and difficult for traditional Hough indexing to reliably differentiate. This is due to the variation in stacking sequencing for each phase, with Si-C bilayers stacked along with c-axis in one of three possible positions. For the 3C phase, there is an A-B-C stacking sequence that repeats every three layers. For the 4H phase, there is an A-B-A-C stacking sequence that repeats every four layers. For the 6H phase, there is an A-B-C-A-C-B stacking sequence that repeats every six layers.
These stacking sequences result in similar EBSD patterns between the polymorphs, with some band positions remaining constant or nearly-constant between the phases for a given crystal orientation. If these bands are the ones detected with the Hough transform, Hough-based indexing will struggle to reliably differentiate these phases. Hough indexing can be optimized by verifying the crystallographic planes active for observed diffraction bands that are used for indexing and detecting an adequate number of bands to attempt to detect bands that are different between the polymorphs, but this is not always easy to achieve.

Figure 1. Experimental EBSD pattern and spherical indexing results from the a) 4H and b) 6H phases.
Materials and results
The solution is to use spherical indexing to analyze the EBSD patterns from the different silicon carbide polymorphs. With spherical indexing, master patterns were generated using dynamic diffraction simulation models for each of these three silicon carbide phases. Experimentally collected EBSD patterns captured with an EDAX® Velocity™ Ultra detector were then indexed against these master patterns to determine the assigned crystallographic orientation and phase, based on the best match during the indexing process. The advantage of spherical indexing is that it uses all the information within the experimental EBSD pattern and therefore can differentiate phases using the smaller and subtler changes between different polymorphs. Figure 1a shows an experimental EBSD pattern and the spherical indexing results from the 4H phase, with the 3C and 6H alternatives shown, while Figure 1b shows the results from the 6H phase. Visual inspection of the simulated solutions reveals the similarities between the polymorph EBSD patterns at different crystal orientations.
EBSD mapping data was collected from a polycrystalline silicon carbide sample while saving the EBSD patterns. These patterns were then indexed using spherical indexing to differentiate the polymorphs and determine the crystallographic orientation. Figure 2 shows the EBSD phase map, with a 97.2% indexing success rate, using a confidence index >0.2 filter. 75% of the region analyzed was identified as the 6H phase, with 14% 4H, and 11% 3C.
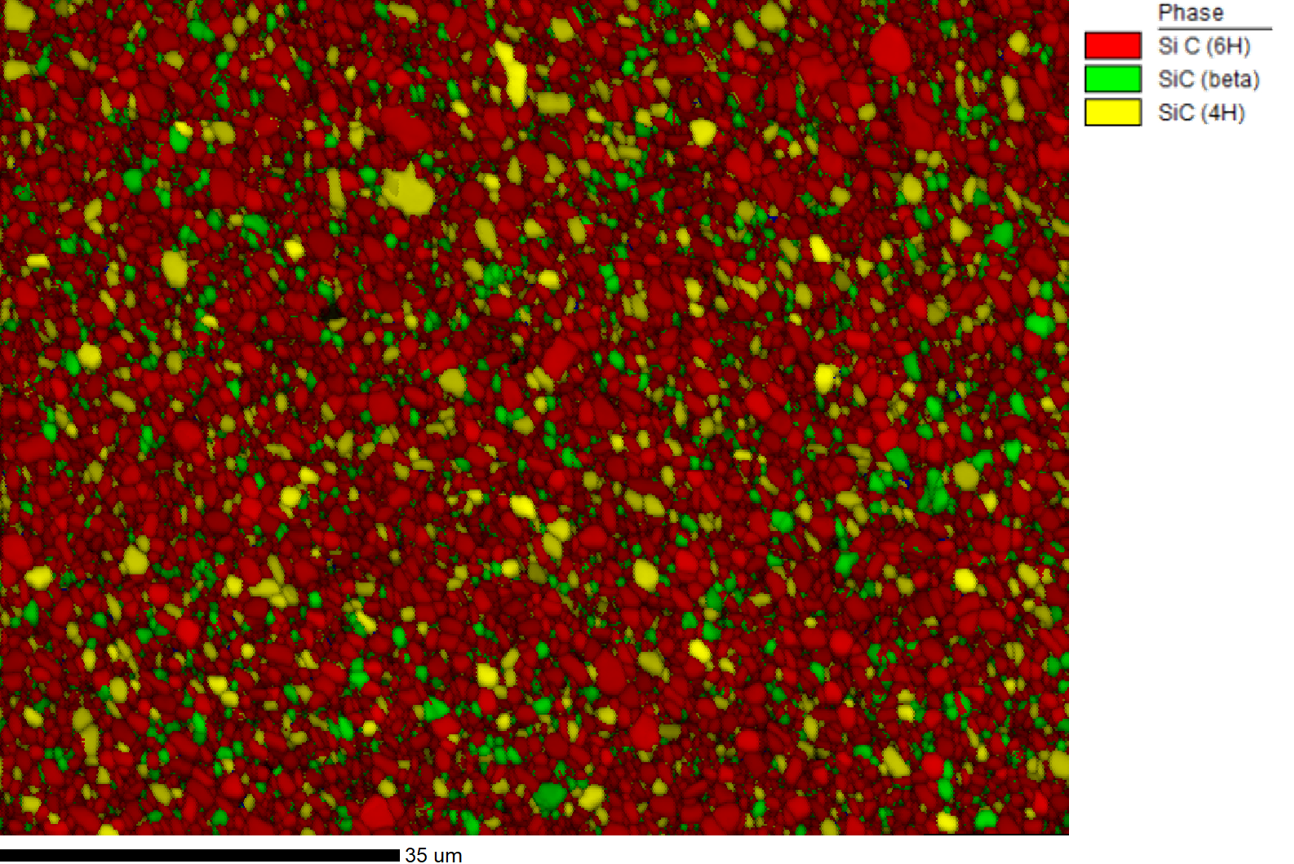
Figure 2. EBSD phase map, with a 97.2% indexing success rate, using a confidence index >0.2 filter. 75% of the region analyzed was identified as the
6H phase, with 14% 4H, and 11% 3C.
Figure 3 shows the EBSD inverse pole figure (IPF) orientation map, with the coloring corresponding to the crystallographic orientation aligned relative to the sample normal direction. The corresponding color keys for the hexagonal 6H and 4H phases and cubic 3C phases are used to identify the orientations. One advantage of EBSD in identifying and differentiating these silicon carbide polymorphs, when compared to x-ray diffraction, is that the spatially specific orientation data can also be used to calculate the grain size and grain boundary character of the measured microstructure. This gives a more complete description of the sample and can allow for better correlation with materials properties and device performance.

Figure 3. EBSD IPF orientation map, with the coloring corresponding to the crystallographic orientation aligned relative to the sample normal direction.
The corresponding color keys for the hexagonal 6H and 4H phases and cubic 3C phases are used to identify the orientations.
Conclusion
EBSD and spherical indexing are ideal for measuring the crystallographic phase and orientation of the different silicon carbide polymorphs. The phase differentiation is optimized by using the entirety of the EBSD pattern information when comparing it to the simulated EBSD master pattern during the spherical indexing process.
Acknowledgement
We would like to thank Ing. Samanwitha Kolli, Deparment of Materials Engineering, KU Leuven for the data.