Dr. Stuart Wright, Senior Scientist, Gatan/EDAX
In spring 2023, my wife and I spent two weeks in Ireland. We had a great trip (with very little rain!). What a beautiful country with wonderful people.
One stop on our itinerary was Trim. Trim is home to the ruins of Trim Castle, the largest Norman castle in Ireland. Trim is situated on the river Boyne and near Brú na Bóinne, a fascinating complex of ancient megalithic monuments, and Monasterboice, which has a great collection of high crosses. We had a great time there—here are a few snapshots.
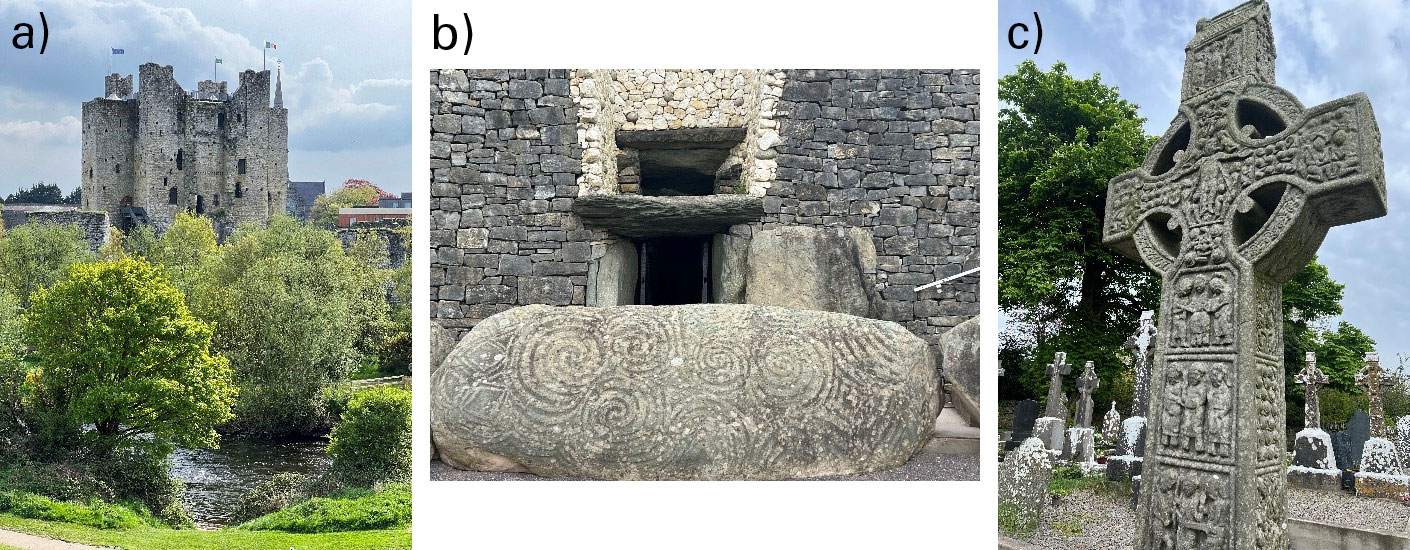
Figure 1. a) Trim castle, b) a passage grave at Brú na Bóinne, and c) a high cross at Monasterboice.
So, how does this relate to quaternions?
We arrived in Trim shortly before the last tour of the castle for the day. We reserved a spot on the tour and then had about a half hour before the tour started, so we wandered around the village surrounding the castle. On one stone building, I noticed a pink plaque on a wall. When I walked over to get a closer look, I was surprised that the plaque read that the mathematician William Rowan Hamilton, “the originator of quaternions,” lived in the building as a boy. Unfortunately, I wasn’t aware that the idea of quaternions came to him on the Broom Bridge in Dublin, so I missed a plaque marking the spot during our time in Dublin.
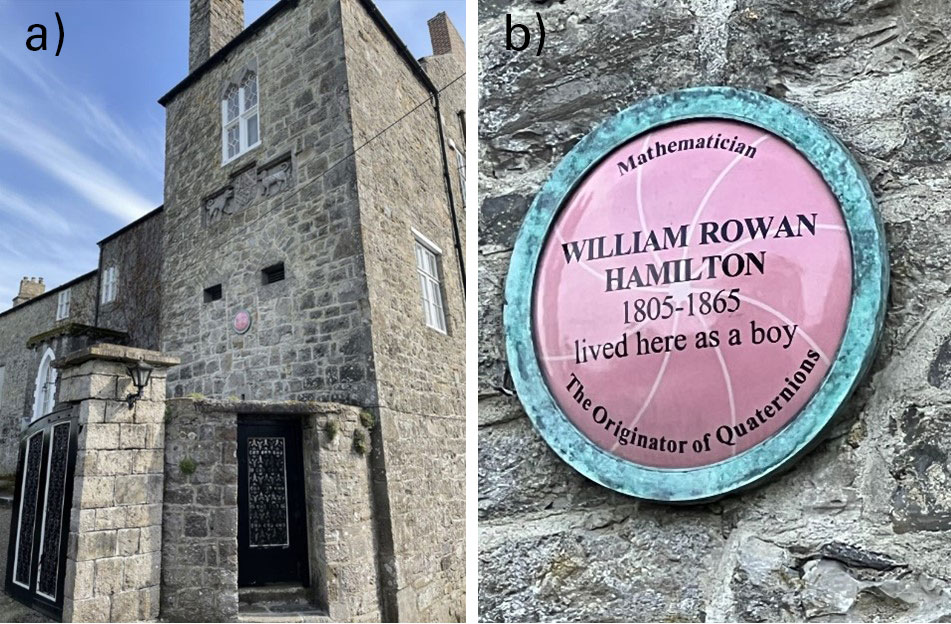
Figure 2. a) Pink plaque on a wall in Trim, Ireland. b) A close-up of the Hamilton plaque.
Sir William Rowan Hamilton’s paper “On Quaternions; or on a new System of Imaginaries in Algebra” was published in 18 installments in the London, Edinburgh, and Dublin Philosophical Magazine and Journal of Science over seven years (1844-1850). Each installment ended with “To be continued” – even the last one (thanks to Professor Marc De Graef of Carnegie Mellon University for this fascinating historical note).
When I first got involved with texture analysis while an undergraduate with scant knowledge of crystallography (I was a mechanical engineering student), I was overwhelmed to learn how many ways crystallographic orientation (and misorientation) could be represented. I learned about Euler angles in the format Hans-Joachim Bunge [1] used and then in the format Ryong Joon Roe [2] used: pole figures and inverse pole figures, crystal planes {hkl} and directions , rotation matrices, axis-angle pairs, ... I remember Sir Charles Frank [3] giving a plenary lecture at my first ICOTOM conference in 1987 in Santa Fe on Rodrigues vectors and Jan Pospiech [4] talking about quaternions as well (I ran the projector as a student helper for his lecture). I certainly didn’t appreciate the advantages and disadvantages of all these different orientation descriptions. At the recent ICOTOM in Metz, France, I saw another representation presented by Professor Marc De Graef– the Clifford torus [5].
During the development of the automated EBSD technique, we needed to quickly develop a way to average a set of similar orientations. I thought about averaging Euler angles or going through the trouble of calculating an orientation distribution function (ODF) using Bunge’s methodology and then finding the peak of the ODF, but I realized quickly both approaches would be cumbersome and slow. Since I was using matrices to describe the orientations, I settled on individual averaging of the nine components of the orientation matrix and then reinforcing the orthogonal symmetry of the matrix. This was relatively fast and gave reasonable results. This was the method used in our earliest automated system [6] (which used the Burn’s algorithm to detect the bands as opposed to the Hough transform, and that we adopted shortly after). Using this approach, we got the blazing speed of four seconds per pattern (on a Silicon Graphics 4D Mini-Supercomputer that cost over $100K in 1989)!
Shortly after, Karsten Kunze joined our research group as a Post-Doc. Karsten was the best crystallographer in our group, and he quickly became a key contributor to the automated orientation imaging microscopy (OIM) project. Karsten had some experience with quaternions and recognized a better way to average a set of similar orientations using quaternions that is detailed in a paper we wrote comparing the Burn’s and Hough transform-based indexing methods [7]. We continued to use Karsten’s methodology in OIM Analysis™ until the release of version 9. Karsten is now at ETH Zürich. I had the great opportunity to spend time with him in Zürich after the ICOTOM in Metz. It was fun to reminisce about those early OIM days and some of our adventures outside of work.
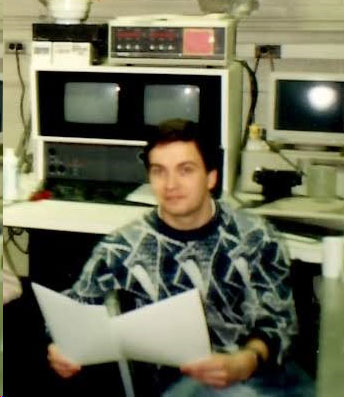
Figure 3. Karsten Kunze at Yale University in front of the first automated EBSD system ~1991.
In version 9.0, we revamped the OIM Analysis orientation math engine. In previous versions, we used a mix of rotation matrices and quaternions for orientation-related calculations. While in the user interface, orientation and misorientations are represented as Euler angles, {hkl}, axis-angle pairs, or even Rodrigues vectors, the calculations have been performed “under the hood” using rotation matrices and quaternions. This has served us well for many years.
As our EBSD systems have gotten faster and faster, the volume of data being produced has gotten larger and larger. Developing a more efficient computation engine for OIM Analysis to analyze these large datasets has become necessary. We have partially done this by harnessing the computer's power by implementing some calculations on the GPU and more efficient multithreading. But we have also switched almost entirely to quaternions “under the hood.” There are four components to a quaternion orientation description instead of nine components in the orthogonal matrix description. Thus, there is a significant reduction in the memory needed. Many of the calculations are faster, and we avoid switching back and forth between matrices and quaternions.
These changes to OIM Analysis 9 have made the software more responsive and robust. We think you will notice and appreciate the effort to improve the software, especially when analyzing large datasets.
Figure 4. EDAX OIM Analysis 9
References
- Bunge, H.J., 1969. Mathematische Methoden de Texturanalyse, Akademie-Verlag, Berlin.
- Roe, R.J., 1965. Description of crystallite orientation in polycrystalline materials. III. General solution to pole figure inversion. Journal of Applied Physics, 36, 2024-2031.
- Frank, C., 1988. Orientation mapping: 1987 MRS Fall Meeting Von Hippel Award Lecture. MRS Bulletin, 13, 24-31.
- Morawiec, A. and Pospiech, J., 1989. Some information on quaternions useful in texture calculations. Textures and microstructures, 10, 211-216.
- De Graef, M., 2024. Applications of the Clifford torus to material textures. Journal of Applied Crystallography, 57, 638-648.
- Wright, S.I. and Adams, B.L., 1992. Automatic analysis of electron backscatter diffraction patterns. Metallurgical Transactions A, 23, 759-767.
- Kunze, K., Wright, S.I., Adams, B.L. and Dingley, D.J., 1993. Advances in automatic EBSP single orientation measurements. Textures and Microstructures, 20, 41-54.